
Months ago I had a few skills helping me in local development. They quickly grew into three dozen skills and agents working together, what people now call a “software factory”. It became harder and harder to keep track of how they work together.
One can always ask Claude to fix a problem once it is seen. But I think it is vitally important for a software engineer to understand such a system. That drove me to build an X-ray: after a session, long or short, I want to see what my factory did. I am a visual person, and visual inspection lets me spot inefficiencies and bugs.
What I had in mind was a profiler, but for a software factory built from Claude skills and agents. After trying several visualizations, I found that adapted UML sequence diagrams work best for me.
The plugin
So here it is: harness-profiler, a Claude Code plugin.
To install it, run these two commands in Claude Code:
/plugin marketplace add afurmanov/harness-profiler
/plugin install harness-profiler@harness-profiler
That is Claude Code on your machine. The profiler works in Claude Code on the web as well. There you commit the hook to the repository:
npx -y github:afurmanov/harness-profiler init claude
The plugin installs a hook that fires after every tool call in a session: each Skill, Agent, Bash and MCP call. For each call the hook appends one JSON line to .harness-profile/<session>.jsonl in the project, with the tool, its arguments, the duration, the token counts and the subagent the call ran in.
To see the session as a page, run /harness-profiler:show-profile. It wraps this command and opens the result:
npx -y github:afurmanov/harness-profiler tree --format html > trace.html
A small example
The plugin README has a toy factory, small enough to hold in your head. An orchestrator skill starts a process-story subagent for each story. The subagent runs two skills inline, planner and implementor. Then implementor calls validator, which runs in its own context. Last, a forked github skill writes the PR description and calls validator again.
Here is the profile of one story going through it:
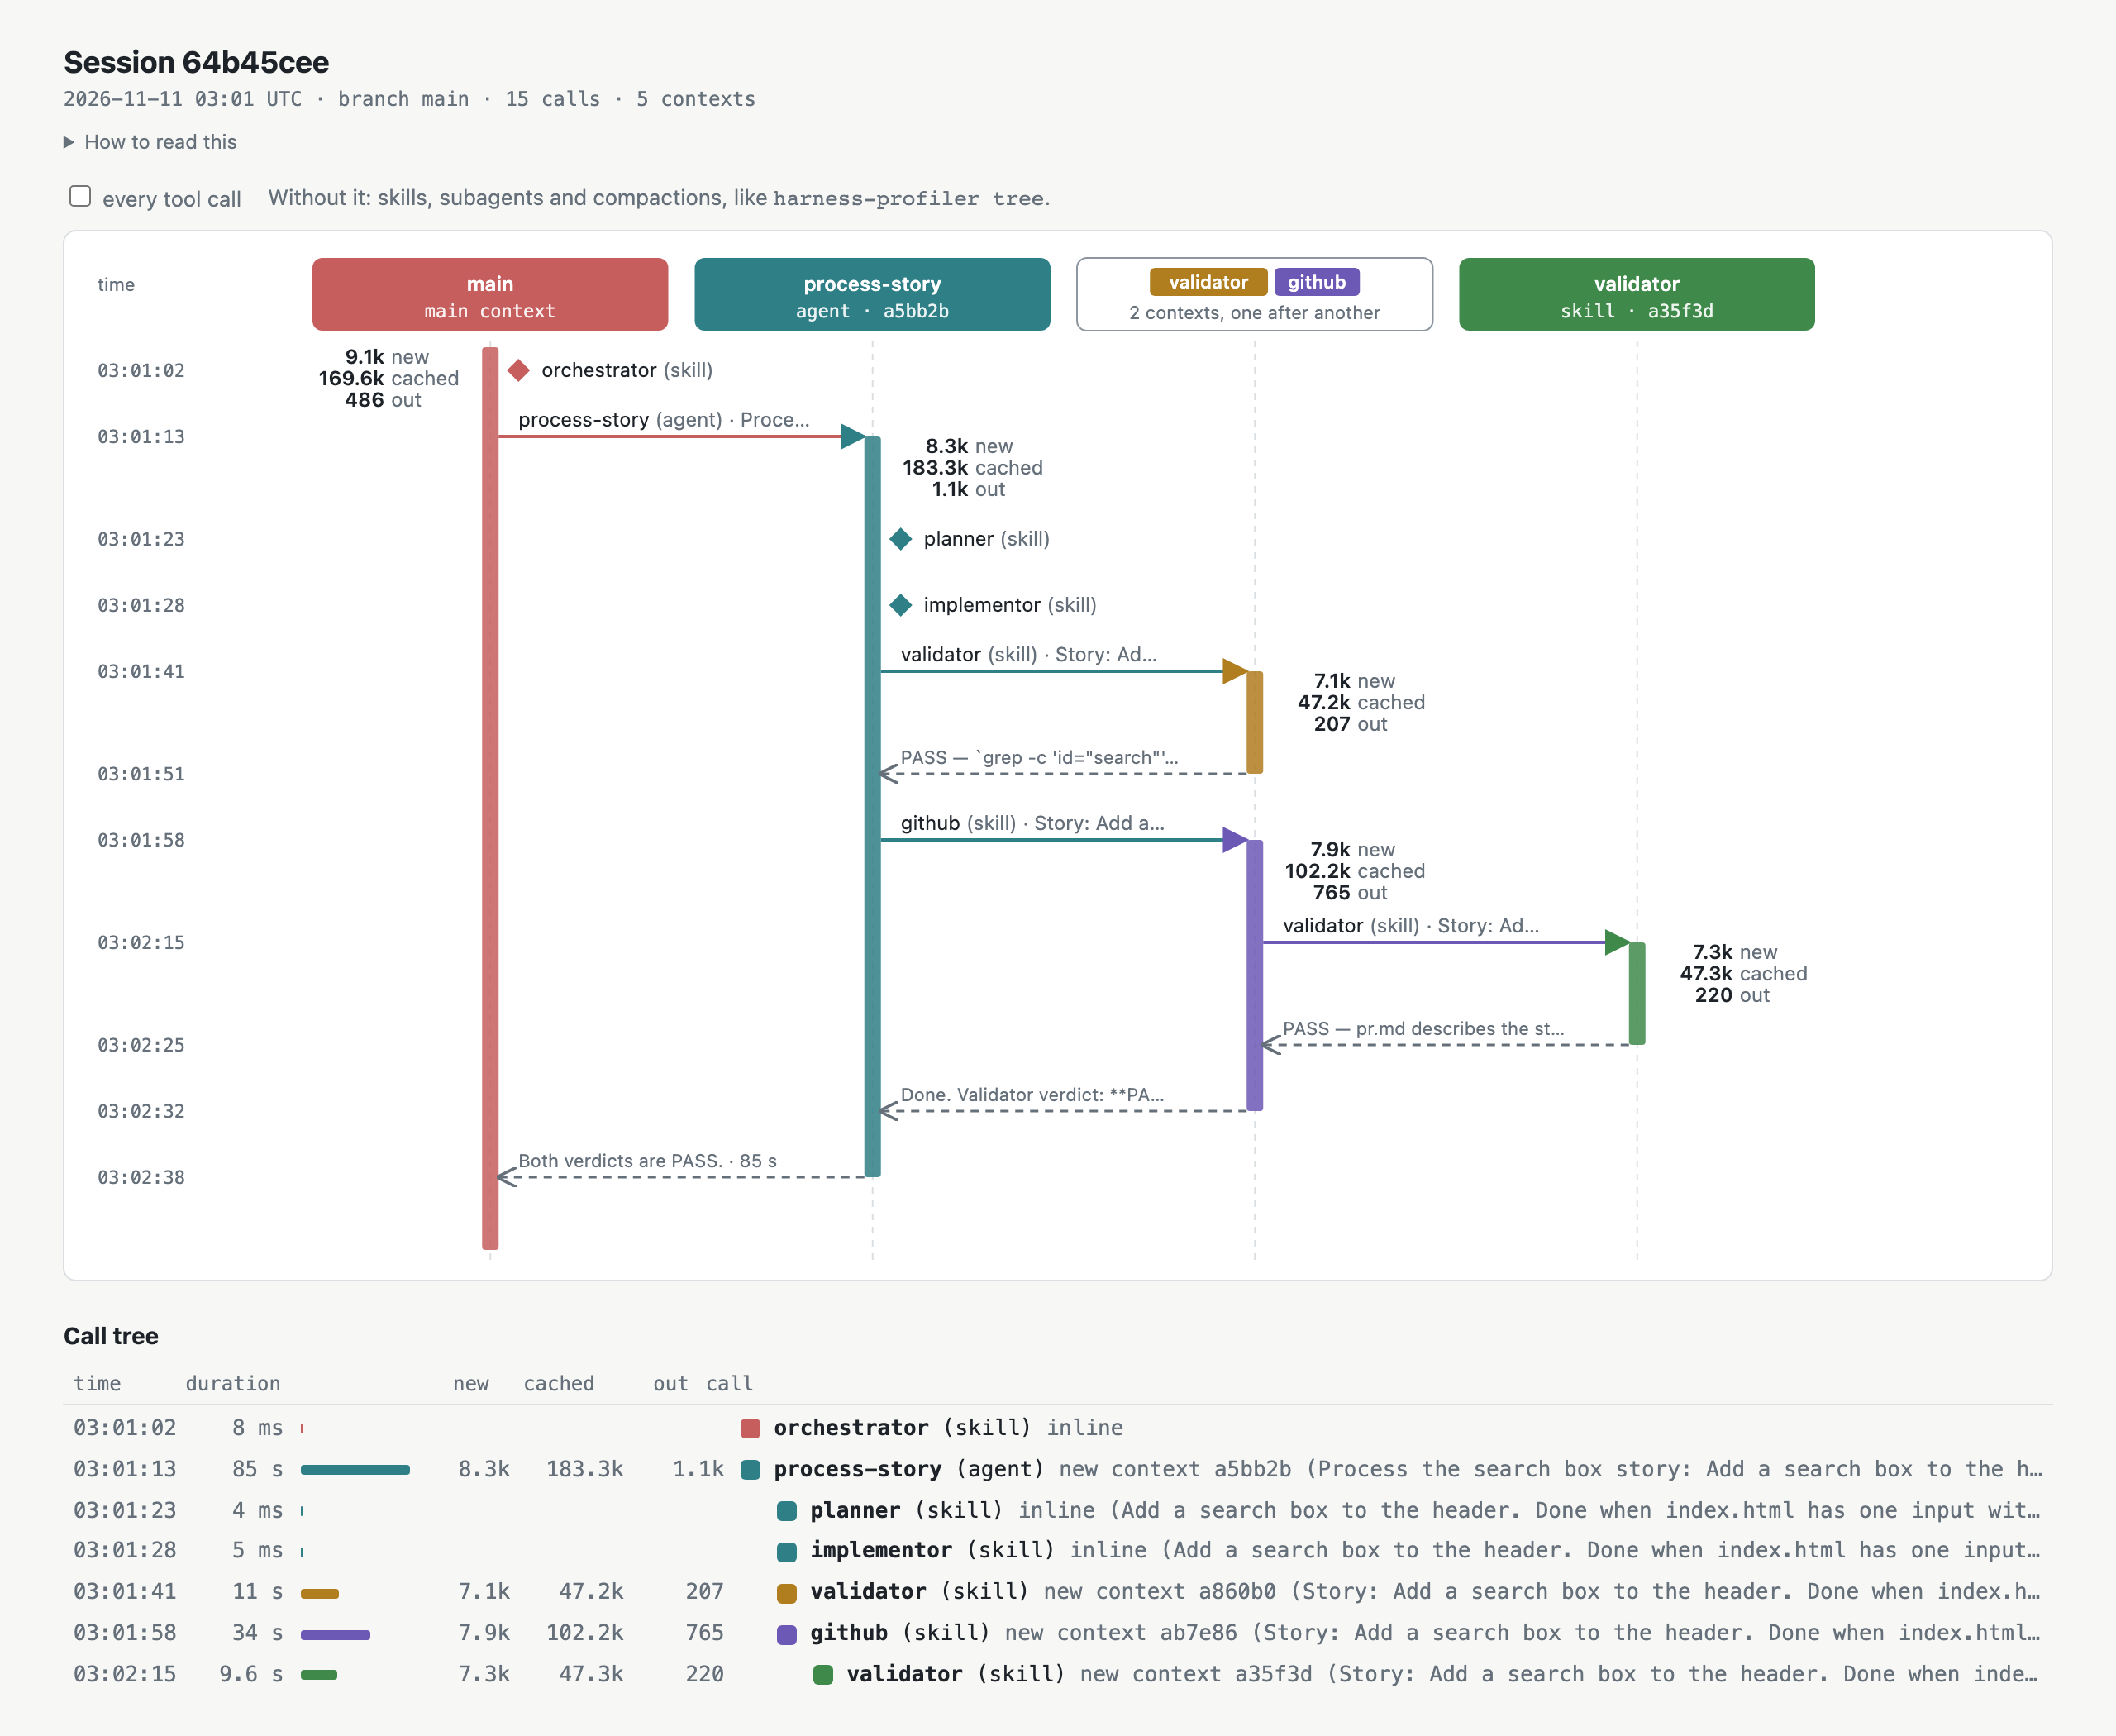
How to read it:
- Each vertical bar is a context: one conversation history that the model reads. Time runs down, so a longer bar is a longer-lived context.
- A forked skill or a subagent starts with a fresh context, and gets its own bar and its own color. A solid arrow starts it, and a dashed arrow carries its result back.
- A diamond is a skill loaded inline. It adds its instructions to the context it was called from, so it gets no bar of its own.
- The token counts sit next to each bar: new, cached and output tokens for that context.
The call tree under the diagram lists the same calls as rows, with the duration and tokens of each one.
Now the factory is easy to follow. The red bar is my main session, and orchestrator is a diamond on it. The teal bar is process-story, with planner and implementor as diamonds. validator ran twice, once from implementor and once from github, and each run got a fresh context of its own.
A real session with a real problem
The setup
I gave my factory a small change: a Ruby SDK should reject a blank API key. You only need to know a few of its parts.
validate is the validation step. It runs in a subagent and calls other skills. rails-expert reviews the Rails code. test runs the tests. lint runs the linter. good-comments audits the code comments.
The workflow calls validation twice. The first run comes after the code change. Then the agent trims its planning doc down to a short decision record, and validation runs once more as the “final” check.
The second run is meant to be cheap. Before running a check, the validator asks the trace what already passed. A check that passed after the last change to its files is reused instead of rerun. Between the two runs only the planning doc changes, so only the doc checks should run.
What the profile showed
Here is what the two validation runs cost:
| Run | Started | Duration | New tokens | Cached tokens | Output tokens |
|---|---|---|---|---|---|
| First validation | 15:39:23 | 69 s | 66.7k | 426.4k | 2.9k |
| Final validation | 15:40:45 | 60 s | 48.0k | 447.0k | 3.2k |
The final run re-ran everything. Its Rails review alone took 14 s and 41.4k new tokens (189.8k cached), and tests and lint ran again too. The first run had passed all of them, and the only file that changed in between was Markdown.
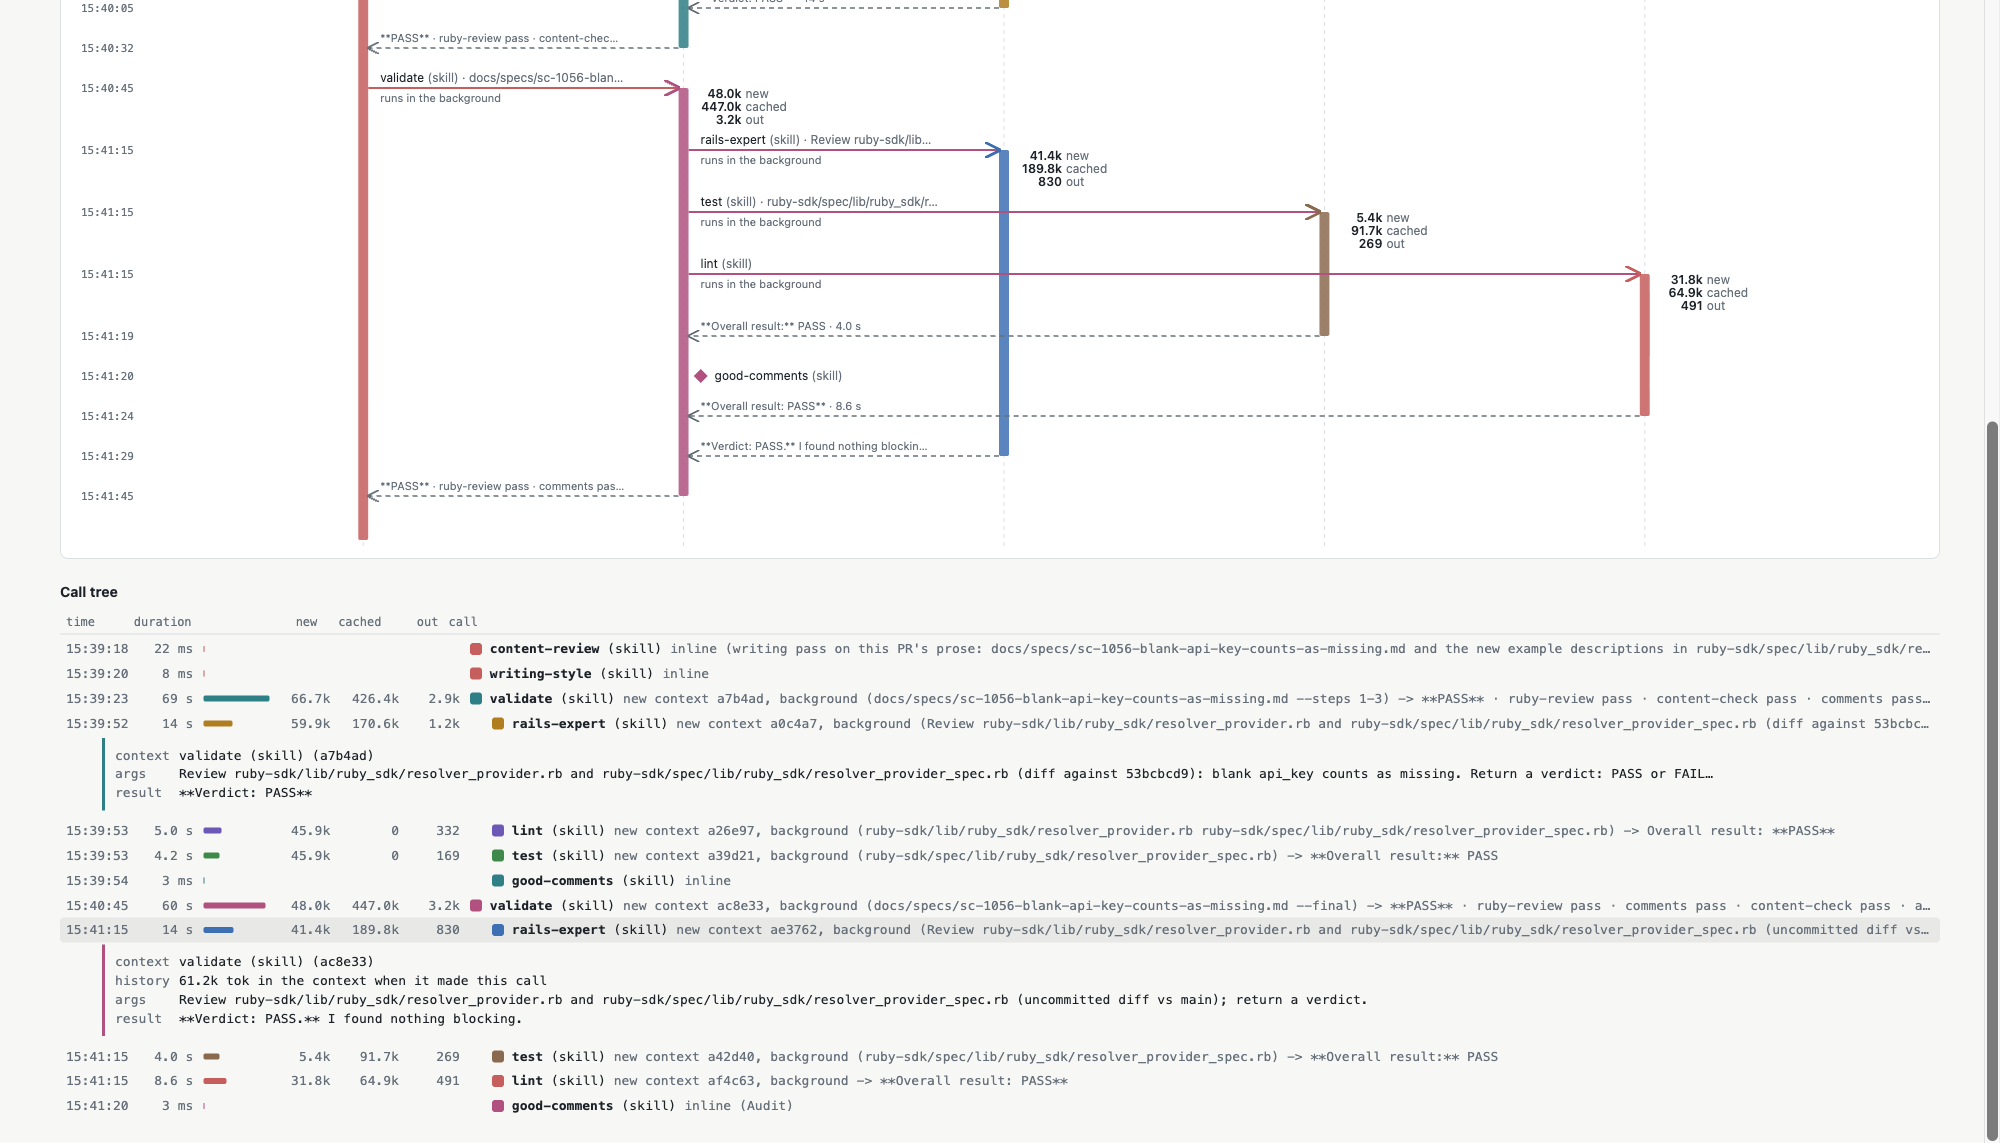
You can open the full profile and click through it yourself.
I didn’t find this by reading logs. I opened the profile, saw two validation bars of almost the same length with the same children under each, and asked two questions: why does the second one exist at all, and why does it call the Rails review again? Both runs reported PASS, so without the profile nothing looked wrong.
The fix
Once I saw the problem, the fix in my setup was easy. There were two causes. The agent left the code uncommitted before the final validation, so the reuse rule treated every Ruby file as changed. And the script that decides what to reuse crashed under an old system Ruby. Now the workflow commits first, and the script runs under the project’s Ruby.
Both runs reported PASS before the fix and after it. The waste was up to a minute and 48k new tokens per change, and only the profile made it visible.
Every tool call
By default the page shows skills, subagents and compactions. For a deeper investigation, check “every tool call” at the top of the page. Then each Bash, Read, Edit and MCP call shows up in the diagram and in the call tree, with its arguments and result. The command line has the same switch: tree --verbose.
Write your expectations down
What I find most important: if you capture such traces regularly, you learn what a healthy session of your factory looks like. Then it is easy to put those expectations in writing and have a skill check every new trace against them. The trace is plain JSON lines, so Claude can read it.
The plugin README has an example for the toy factory above:
---
name: check-trace
description: Checks the newest harness-profiler trace against what the story setup should do.
---
Run `npx -y github:afurmanov/harness-profiler tree --verbose` and check:
1. Every story ran in its own `process-story` subagent: `planner`, then `implementor`, then `validator`, in that order.
2. `github` ran inside `process-story` only after the first `validator` reported PASS, and called `validator` on `pr.md`.
3. Every `validator` ran in a new context, never inline, and returned PASS or FAIL on its first line.
4. No skill ran twice for the same story, other than the two `validator` calls.
Report each check as pass or fail, with the tree line that shows it.
For my factory, the double validation becomes one more line in such a skill: the final validation runs only the doc checks. Next time I don’t have to spot it by eye.
Comments