
John looked at the big pile of unopened envelopes. “They contain either bad or good news. What is the average ratio between them?” - he asked himself. John loved statistics. This time some bad news arrived from a medical lab. The test John made a week ago came up positive. It was a company policy to ask employees to have this test - John did not feel sick. He had been feeling pretty well recently.
Investigation by Ruby coding
“So maybe it is some kind of mistake?” - wondered John and started googling. It turns out this specific test could have false positives and false negatives. The test accuracy described as sensitivity and specificity. For John’s test those values were found as:
- Sensitivity (or chances test is positive for a sick person) - 90%
- Specificity (or chances test is negative for a non-sick person) - 95%
“Those a grain of good news. Maybe there is a 5% chance I am not sick”, - sighed John. “Test is positive in 5% cases for healthy therefore I might belong to that 5%” - he kept thinking - however, something did not feel right to him in this reasoning. Not sure what it could be, John decided to validate his theory. “Why not write just a unit test for it?” - this thought came to his mind. “After all, if we write tests for software behavior assumptions, then why not use them for validating theories?” - he kept reasoning. John started typing and produced the code:
require 'minitest/autorun'

DiseaseData = Struct.new(:total, :sick) do
  def well
    total - sick
  end
end

SENSITIVITY = 0.9
SPECIFICIITY = 0.95

# John initial assumptin test
class IntuitionTest < Minitest::Test
  def simulate_disease_data
    DiseaseData.new(1_000_000, 1000)
  end

  def test_5pct_guess_test
    disease_data = simulate_disease_data
    tested_positive_if_sick = disease_data.sick * SENSITIVITY
    tested_negative_if_well = disease_data.well * SPECIFICIITY
    tested_positive_if_well = disease_data.well - tested_negative_if_well
    tested_positive = tested_positive_if_well + tested_positive_if_sick
    chances_of_being_sick_if_tested_positive = tested_positive_if_sick / tested_positive
    chances_of_being_well_if_tested_positive = 1.0 - chances_of_being_sick_if_tested_positive
    assert_in_delta(0.05, chances_of_being_well_if_tested_positive)
  end
end
The test failed:
  1) Failure:
IntuitionTest#test_5pct_guess_test [...]:
Expected |0.05 - 0.9823008849557522| (0.9323008849557521) to be <= 0.001.
It looked very suspicious, the chances_of_being_well_if_tested_positive value is 0.982, i.e.about 98% which is way far from 5%.
“How that could be?” - wondered John and looked at his code again. “Something fishy is going on. Maybe there is some error in the code. Let’s trace it step by step” - he was thinking and launched a debugger.
Stepping through the test code revealed that tested_positive consists of two groups:
- actually sick (tested_positive_if_sick): 900
- not sick, but falsely tested as having a disease (tested_positive_if_well): 49950
The first group happens to be small relative to the entire population because there are only 1000 per million people assumed to be sick in the unit test and only 90% of them were identified as having a disease. The second group is much larger than the first one since it consists of false positives. False positives are not frequent (only 5% of cases), however since the group of well people is much larger (almost a million), the 5% are still a big number. That difference is responsible for small value of chances_of_being_sick_if_tested_positive (0.018) and large value of chances_of_being_well_if_tested_positive (0.982).
Investigation via Bayes Theorem
John realized that his initial assumption could be incorrect. If chances of being sick as encoded in the unit test are 0.1% (which is realistic), then John’s chances to be well are 98%, rather than 5% as he initially assumed.
Still wondering how this could be and not believing those results he recalled the Bayes Theorem is something what could be used to answer his concerns.
Here are known probabilities:
\[\begin{multline} \shoveleft P(Test=Positive|Disease=Yes) = 0.9\\ \shoveleft P(Test=Negative|Disease=No) = 0.95\\ \shoveleft P(Disease=Yes) = 0.001 \end{multline}\]And question John was looking answer to could be exressed in mathematical form as:
\[\begin{multline} \shoveleft P(Disease=Yes|Test=Positive) = ? \end{multline}\]The Bayes Theorem formula is
\[\begin{multline} \shoveleft P(A|B)=\frac{P(B|A)P(A)}{P(B)} \end{multline}\]and after substituting events of interest in it, it becomes:
\[\begin{multline} \shoveleft P(Disease=Yes|Test=Positive) = \frac{P(Test=Positive|Disease=Yes)P(Disease=Yes)}{P(Test=Positive)} \end{multline}\]Two values in numerator are known, the value in denominator could be calculated as:
\[\begin{multline} \shoveleft P(Test=Positive) = \\ \shoveleft \hspace{1cm} (Test=Positive, Disease=Yes) + P(Test=Positive, Disease=No)=\\ \shoveleft \hspace{1cm} P(Test=Positive|Disease=Yes)P(Disease=Yes)+\\ \shoveleft \hspace{2cm} P(Test=Positive|Disease=No)P(Disease=No)=\\ \shoveleft \hspace{1cm} 0.9\cdot0.001 + (1-0.95)\cdot0.999=0.05085 \end{multline}\]therfore,
\[\begin{multline} \shoveleft P(Disease=Yes|Test=Positive) = \frac{0.9\cdot0.001}{0.05085} = \textbf{0.018}\\ \shoveleft P(Disease=No|Test=Positive) = 1 - 0.018 = \textbf{0.982} \end{multline}\]Getting the same result as with Ruby unit tests boosted John confidence - indeed there are 98% chances he is not sick, even after seeing positive test result. “Those are great news!” - said John and started feeling his anxiety was going away.
Investigation via Bayes Network
What John did not know is that there is another way to answer the same question, which could have been even simpler than the methods he used. If he had known about Bayesian Networks and inference engines he would be able to use them without going deeply into the business of calculating probabilities of his interest.
Bayesian Network is an acyclic graph where every node represents a probabilistic variable. The graph describes independencies between variables. What does it mean? It means a simple thing, the distribution of a variable in the child node depends only on the values of its parents and “ignores” values of any other nodes in the graph. Assigning a value to a probabilistic variable (or observing it as having some value) changes distributions of other nodes. A Bayesian inference engine is a tool that could figure out update distribution and answer various probabilistic questions about an updated graph. It might sound unclear, so consider how Bayesian Network could be used to help John. He could have created this network:
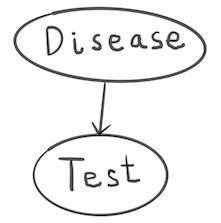
There are two variables here DISEASE and TEST. DISASE variable could have values YES and NO. The TEST variable could have values POSITIVE and NEGATIVE. The distribution of the TEST variable is different for sick and non-sick persons:
| Disease | Test=POSITIVE | Test=NEGATIVE |
|---|---|---|
| YES | 0.9 | 0.1 |
| NO | 0.05 | 0.95 |
Note - the sum of every row is always equal to 1. The DISEASE variable does not have parents, and its distribution is:
| Disease=YES | Disease=YES |
|---|---|
| 0.001 | 0.999 |
Using Bayesnet gem, this network could be described as:
require 'bayesnet'

# Example of Bayesian Network:
def model
  Bayesnet.define do
    node :disease do
      values yes: 0.001, no: 0.999
    end

    node :test, parents: [:disease] do
      values [:positive, :negative] do
        distributions do
          as [0.90, 0.10], given: [:yes]
          as [0.05, 0.95], given: [:no]
        end
      end
    end
  end
end
The Bayesian Network returned by model method could be asked various probabilistic questions, for example:
“If we see a POSITIVE result of test (evidence), what are chances to see DISEASE variable in state YES?:”
model.chances({disease: :yes}, evidence: {test: :positive})
As expected, the answer is the same as John received earlier, i.e. - 0.018. Some other questions could be asked, for example,
“Given the evidence X, what distribution of variables A, B, C?”.
Or “What variable Y’s most likely value is going to be, provided evidence X?”.
This is a toy example, of course. It demonstrates, however, the Bayesian Networks might be a useful tool in answering everyday questions. One does not have to be a data scientist or have a mathematical background to build them and use them.
Comments